AWS IoT SiteWise Features
AWS IoT SiteWise
Ingest
Store
Contextualize
Analyze
Visualize
Industrial data dashboard
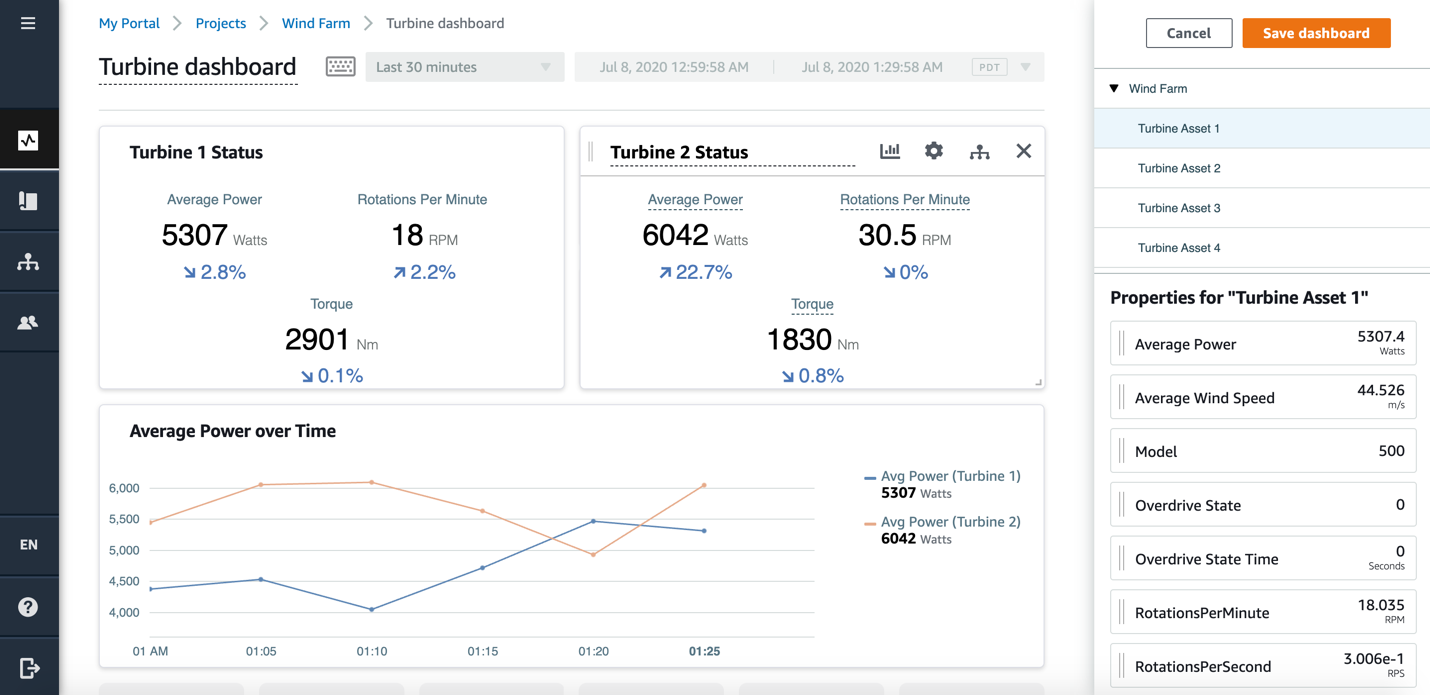
Create no-code, fully managed web applications using AWS IoT SiteWise Grafana plugin or AWS IoT SiteWise Monitor. With this feature, you can visualize and interact with operational data from devices and equipment connected to AWS IoT services. You can automatically discover and display asset data ingested and modeled with AWS IoT SiteWise. View asset data and computed metrics in near real time, or compare and analyze historical time series data from multiple assets and time periods. Visualize data using line and bar charts, add thresholds, and monitor data against these thresholds. Users can access the web applications from a browser on any web-enabled desktop, tablet, or phone, and sign in with their corporate credentials through a single sign-on (SSO) experience. Administrators can create one or more web applications to easily share access to asset data with any team in their organization and accelerate insights. You can also deploy web applications locally using the AWS IoT SiteWise Edge software, so you can visualize equipment data in real time on the factory floor, even when cloud connectivity is temporarily disrupted.
Figure 1: SiteWise Monitor customized web application
AI Assistant
Get started with AWS IoT SiteWise
Did you find what you were looking for today?
Let us know so we can improve the quality of the content on our pages